What FreightMath gives you in BidRight
When you’re pricing a lane, FreightMath populates these data points on the row:Open the columns to review the Source of the information. Some lanes have enough density with that bidding customer to populate with orders you hauled for that exact customer. Other lanes show data from your areas across your customer base.You can also identify this at a glance by text style. Standard font means these orders were actual shipments on this lane with this customer. Lighter gray text means freight is aggregated from other customers as well.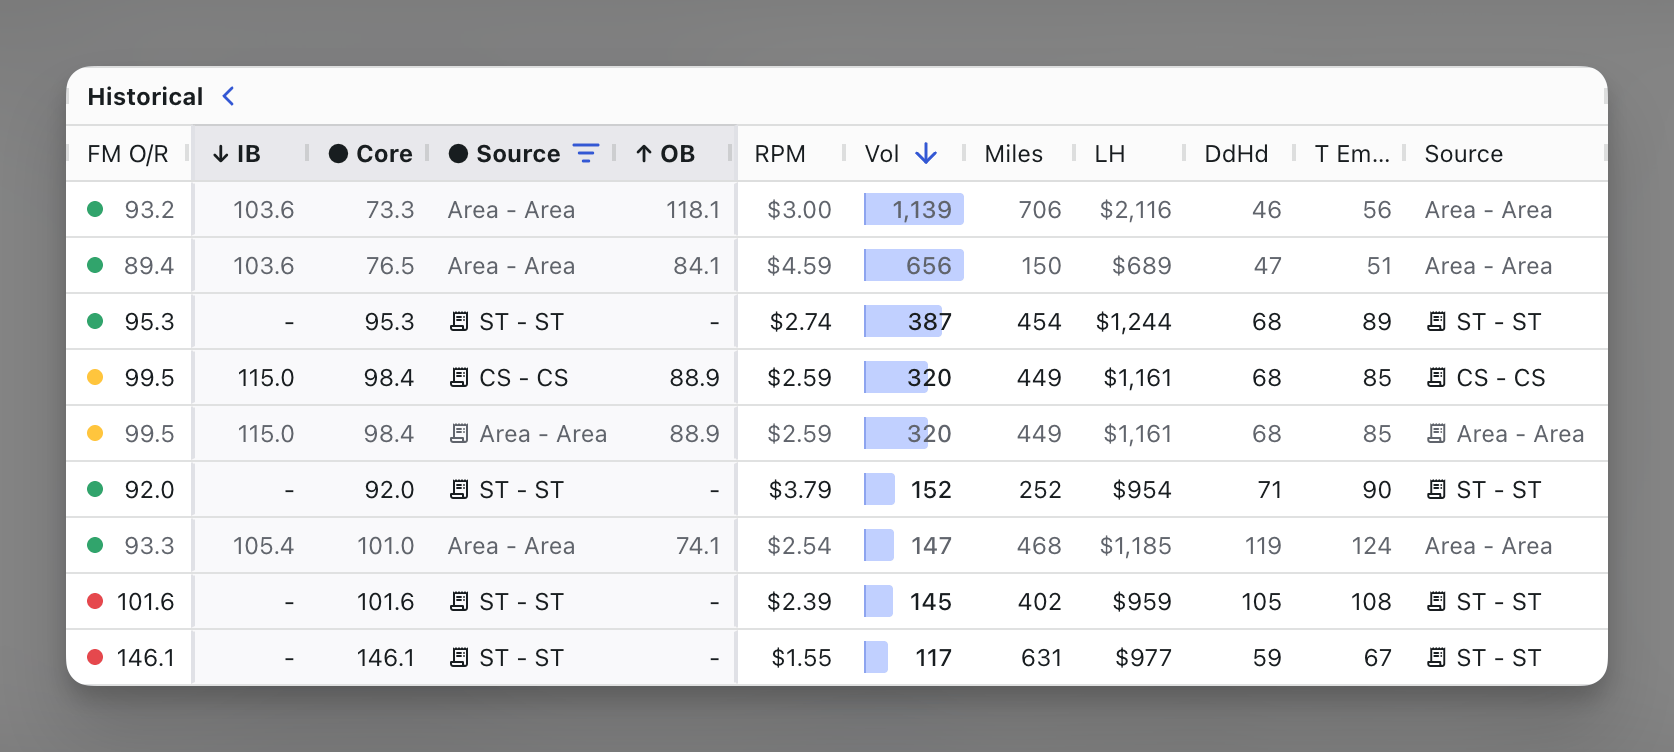
- Historical OR — Your operating ratio on this lane (or area), based on actual shipments.
- Historical volume — How many loads you’ve run on this lane historically.
- Historical RPM — What you charged on this lane in past periods.
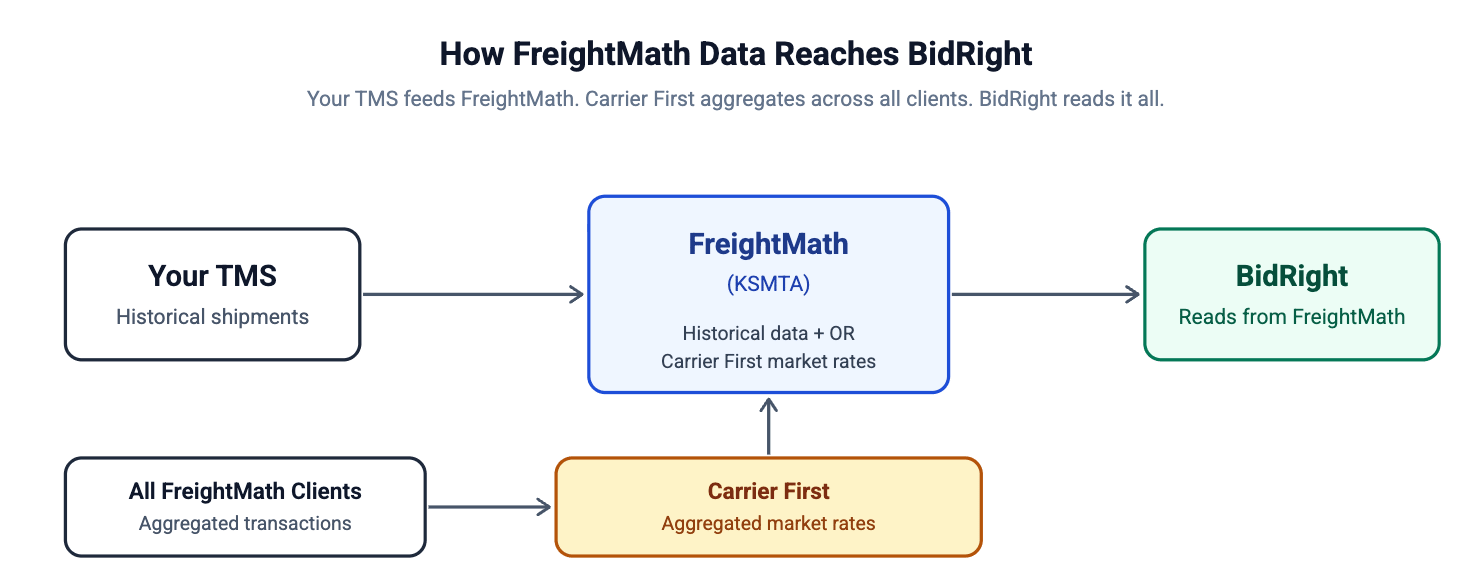
- Carrier First market rate — A market benchmark aggregated from FreightMath’s client base, matched by trailer type and origin/destination.
- FM Operation — The match type used to pull historical data.
How data is matched
FreightMath matches data to bid lanes at the same level the lane is bid at: city-to-city lanes match to city-to-city history, ZIP-to-ZIP to ZIP-to-ZIP, and ZIP3 to ZIP3. When there is not enough data at that level, BidRight falls back through a defined hierarchy. For OR specifically, “enough data” means at least 12 loads in the last 12 weeks. Below that threshold, OR rolls up to a broader level until the threshold is met. See OR Modeling Fallback Hierarchies for how the fallback works.Related content
- FreightMath OR (Operating Ratio) — Historical vs Modeled OR and how FM OR is built
- How data sync works — How FreightMath stays connected to your TMS
- Setting up a customer — Configuring FreightMath data for a specific customer
- Troubleshooting data — What to check when data looks wrong or missing